

The Most Important Tools To Have In Your Kubernetes Cluster
The Most Important Tools To Have In Your Kubernetes Cluster
Today, I'd like to share the first things I set up in my home lab and why I believe they should be the initial components in any cluster—whether it's a home lab or an enterprise cluster

I've recently become obsessed with my home lab—it's my new baby.
I call it a home lab because of what I envision it becoming. For now, it's simply a local Kubernetes deployment running with KinD (Kubernetes in Docker). However, I'm looking forward to expanding it and setting up a real hardware server where I'll deploy a cluster using K3s or K0s. But for now… baby steps.
Today, I'd like to share the first things I set up in my home lab and why I believe they should be the initial components in any cluster—whether it's a home lab, an on-premises setup, or a managed enterprise Kubernetes cluster.
ArgoCD: Before deploying anything else, I needed to automate my applications' continuous integration and deployment. I knew I'd be making frequent changes, so setting up a version control system (VCS)—GitHub in my case—as a single source of truth was crucial. I wanted to establish GitOps principles early on to maintain them throughout the project.
With this in mind, I chose ArgoCD as my continuous delivery tool.
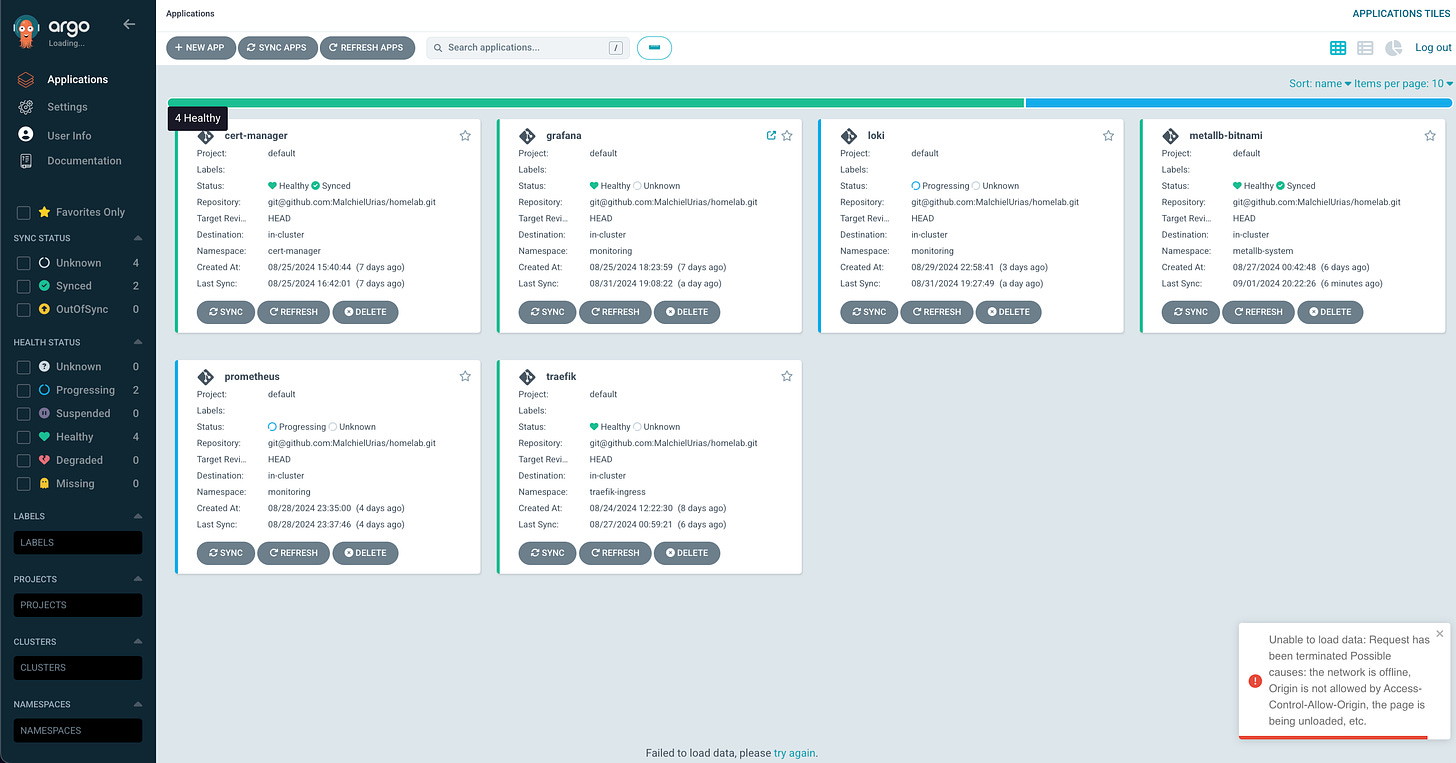
I opted for ArgoCD specifically because of its user-friendly interface and visual appeal. Visuals are important to me, and I have more experience with ArgoCD than FluxCD. Don't get me wrong—FluxCD is great, and many people swear by it. But ArgoCD has served me well, and I've had no reason to switch. It integrates seamlessly with my VCS, offers excellent application management and grouping, and its pull-based approach with auto-sync is one less worry. Plus, it's a handy tool for preliminary debugging.
Since every other tool would be deployed using ArgoCD, it was critical to have it up and running first.
Ingress (Traefik in my case): After successfully deploying my CD tool, my next priority was exposing the application for easy access. I knew I'd need public access to several applications, including the ArgoCD GUI itself. It was crucial to address this quickly. Kubernetes offers numerous ingress controller options, and it's common to see multiple controllers in a single cluster. For my local setup, I chose Traefik. While I've extensively used Nginx ingress in my DevOps career without issues, Traefik presented an exciting opportunity to explore something new.
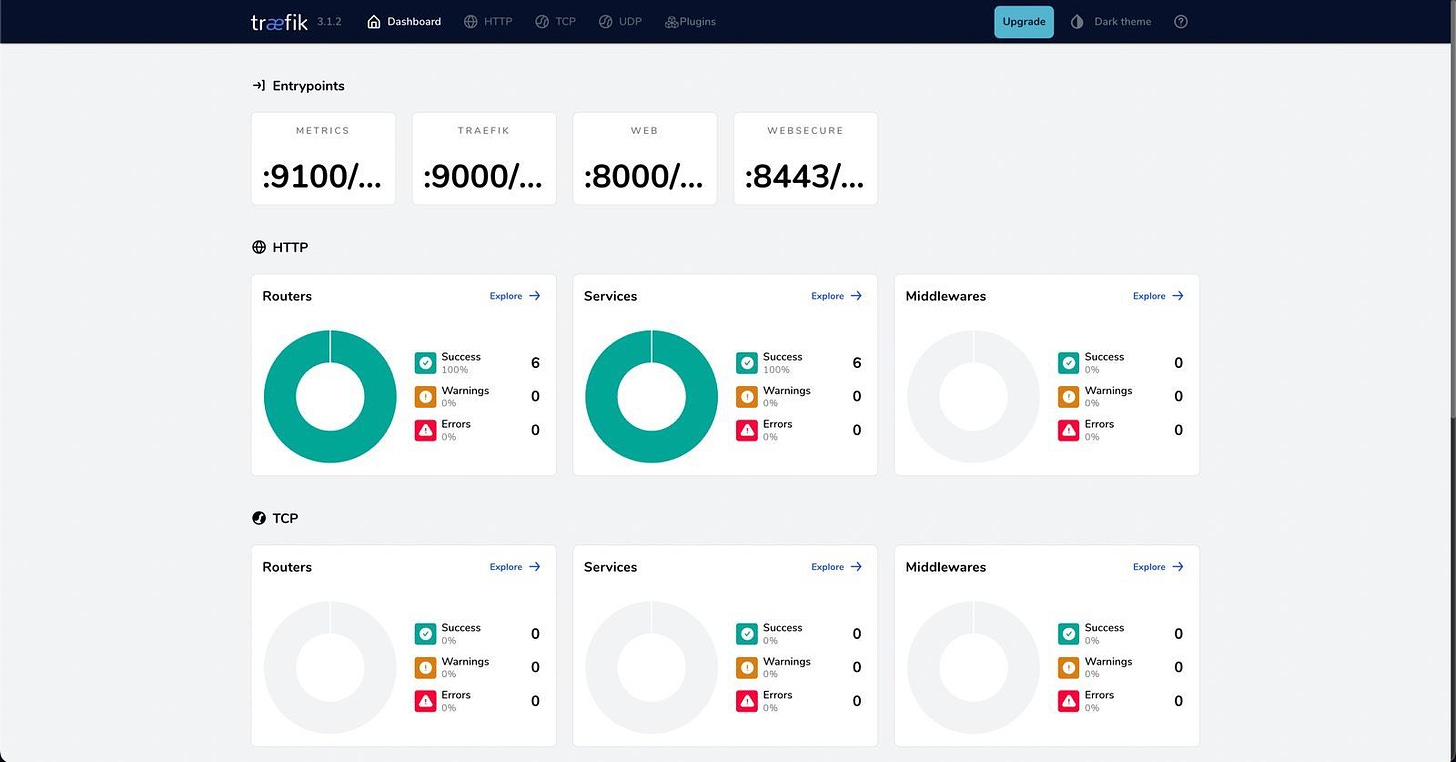
Traefik is a cloud-native tool tailored for microservices environments. It's lightweight (perfect for my local KinD cluster), integrates seamlessly with observability platforms like Prometheus and Grafana, is written in Go, and offers a helpful graphical interface for container visualization. Additionally, Traefik supports the new Kubernetes Gateway API and includes service mesh capabilities, though I don't plan to use the latter feature.
Metal-LB: This one is important and goes hand in hand with the Ingress especially when you are not deploying your cluster in a cloud environment. In a cloud environment, a cloud platform would usually provide a load balancer as one of its services, and it can then be used with the ingress to provide public access to services. However, when working in a self-managed cluster, external load-balancing technologies are not readily available to you, you would need to provision one by yourself. In my cluster, this would be the function of MetalLb.
Prometheus: After the Continuous Deployment tool had been set up and used to handle the deployment of initial networking components, the next crucial thing I needed was to gather data on my cluster and the applications within it to know when something was going wrong. Monitoring and Observability was the next critical step that I needed to establish before moving on to anything else. Prometheus is one of the most widely used monitoring tools in Kubernetes today. It serves as a cluster-wide metric collector time-series database. Many time-series databases can be used like InfluxDB, Graphite, etc. but for its strong integration with Kubernetes, a vibrant community of maintainers and users, and its method of metrics collection, Prometheus has been chosen in this project and many other Kubernetes clusters as the metrics store and collector.
Grafana: For a visual representation of the metrics, logs, and other telemetry data from the cluster, I decided to set up Grafana. Grafana is a great monitoring tool for visualizing telemetry and it integrates perfectly with a lot of other tools which you can use as data sources and be able to pull and visualize their data.
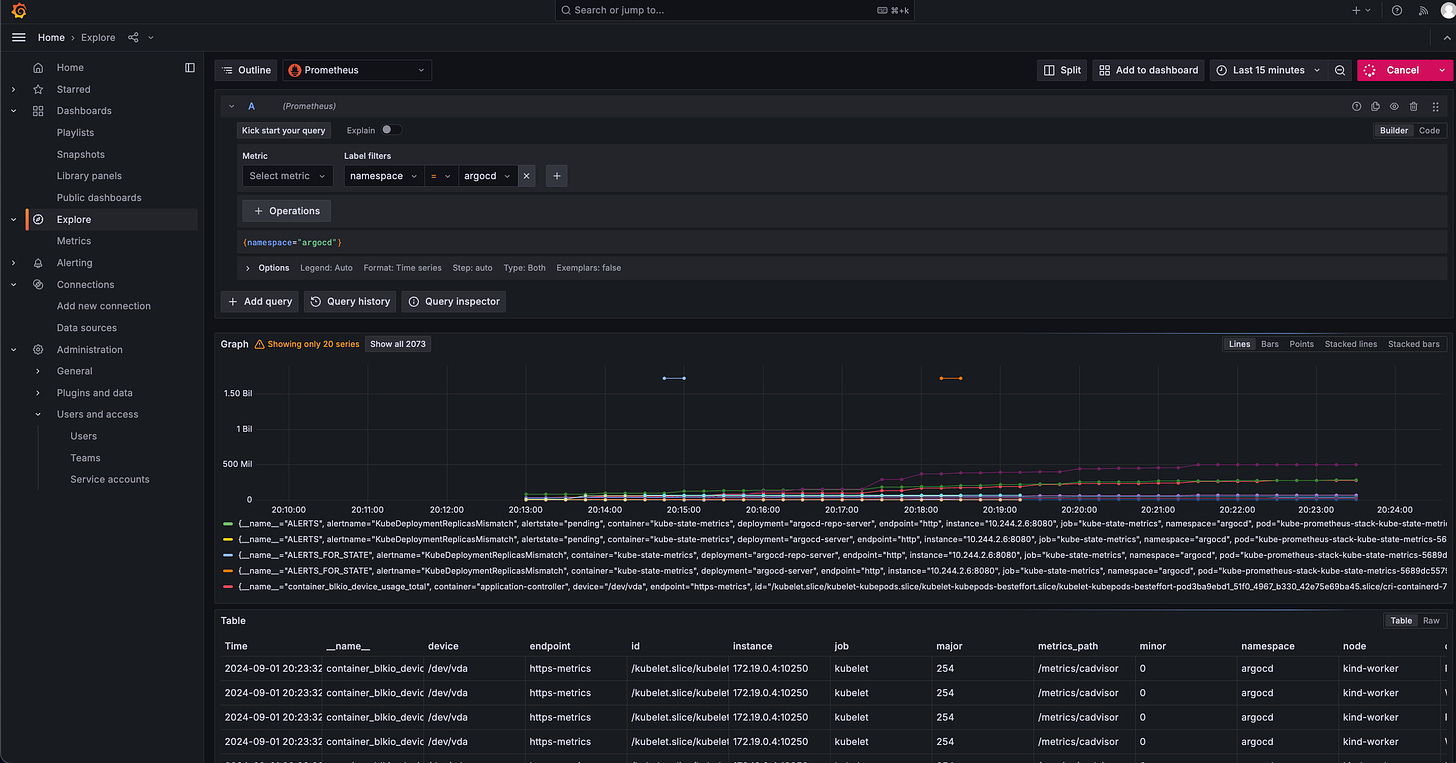
This is going to be the central monitoring tool for my stack for now as I like to have everything in one place, and Grafana has given me the ability to do that. I plan to add Hubble as a data source here in Grafana instead of using a separate dashboard to manage CNI monitoring but that is just my preference.
Loki + Promtail: There are three pillars of observability that you must have within your system. Metric, Logs, and Tracing. I have set up my metric collection and visualization with Prometheus and Grafana, to set up logging in my cluster, I needed to have a log collector that would read and capture the logs from my pods and a log aggregator that can hold and process my application logs. Many tools can be used for this and in my cluster, I have chosen to use Promtail as my log collector and Loki as my log aggregator. Loki was set up as a stateful set to hold the log data and Promtail is a simple daemon set that would run on each worker node to collect and send the logs to Loki. Interestingly, I also took the liberty of configuring Loki as a data source in Grafana so that I can easily see my logs from Grafana, my central monitoring solution.


Planned: I have set up the tools above and have them running in my stack, but I still have plans to improve on this setup to add more important technologies in the coming weeks. Adding these remaining four components would make my cluster ready to manage other application workloads effectively.
These are the tools I have planned to include:
Jaeger: After setting up the two pillars of observability, monitoring, and logging, the obvious final step would be to ensure I can have distributed tracing in my cluster to make it observation for all the resources I would deploy in it. For this, I would be using Jaegar, which is an open-source distributed tracing tool, built with Go. With Jaegar’s distributed tracing technology, I would be able to map the flow of data through my distributed system of micro-services and pinpoint bottlenecks and errors thereby, improving the ability to detect root causes of issues.
Cilium CNI: To manage the networking and connection among the many pods that would run in my cluster, a network interface would provide me with reduced complexity and improved performance. Cilium operates using eBPF (extended Berkely Packet Filter). This would be used to implement network policies, load-balancing, packet tracing, routing, service mesh, and advanced security.
HashiCorp Vault: I know that I would need to deploy a lot of applications that need to be kept secure. Whether I need to secure passwords, certificates, or environmental variables, HashiCorp Vault can be used as my secret manager for all the sensitive data in my cluster.
VPA and HPA: Finally, to be able to efficiently manage the resources of my relatively small setup, I need to be able to scale out and scale down as needed using Horizontal Pod Autoscalers and Vertical Pod Autoscalers. And to also set the most correct resource requests and limits using recommendations from the Vertical Pod Autoscaler.
This setup can be used with a local cluster and also work at scale in an organization running any number of applications. It prioritizes security and observability which are important principles for running any infrastructure.
If you found this article useful, please share it so that more Engineers can see it and set up an efficient home lab cluster.
Also, drop your comments below and let me know what your cluster stack looks like. What are you presently running in your Kubernetes Cluster??
Thank you for reading.